MIAMI VALLEY REGION HOUSING DATA
In this section you will find the latest Dayton market updates, statistics, historical data, press releases, and other Dayton REALTORS® news. Check back often for the latest information.
A REALTOR® and the MLS is the premier source for accurate and up to date data for your market and community.
Local Government Officials
If you are a city or county official and wish to have a more in-depth report created for your city or county, you may contact us for a full report utilizing the REALTOR® Property Resource (RPR) data service. Please send all requests to Dan Douglas, Government Affairs Director, at ddouglas@daytonrealtors.org.
Elected Leaders
If you are an elected official and would like information on demographics, economic talking points, and real estate data for your district, please contact Dan Douglas, Government Affairs Director, at ddouglas@daytonrealtors.org.
General Media Requests
All media requests can be sent to Bob Jones, Communications Director, at bjones@daytonrealtors.org or by calling 937-610-1434.
DAYTON REGION MONTHLY HOME SALES - FEBRUARY 2024
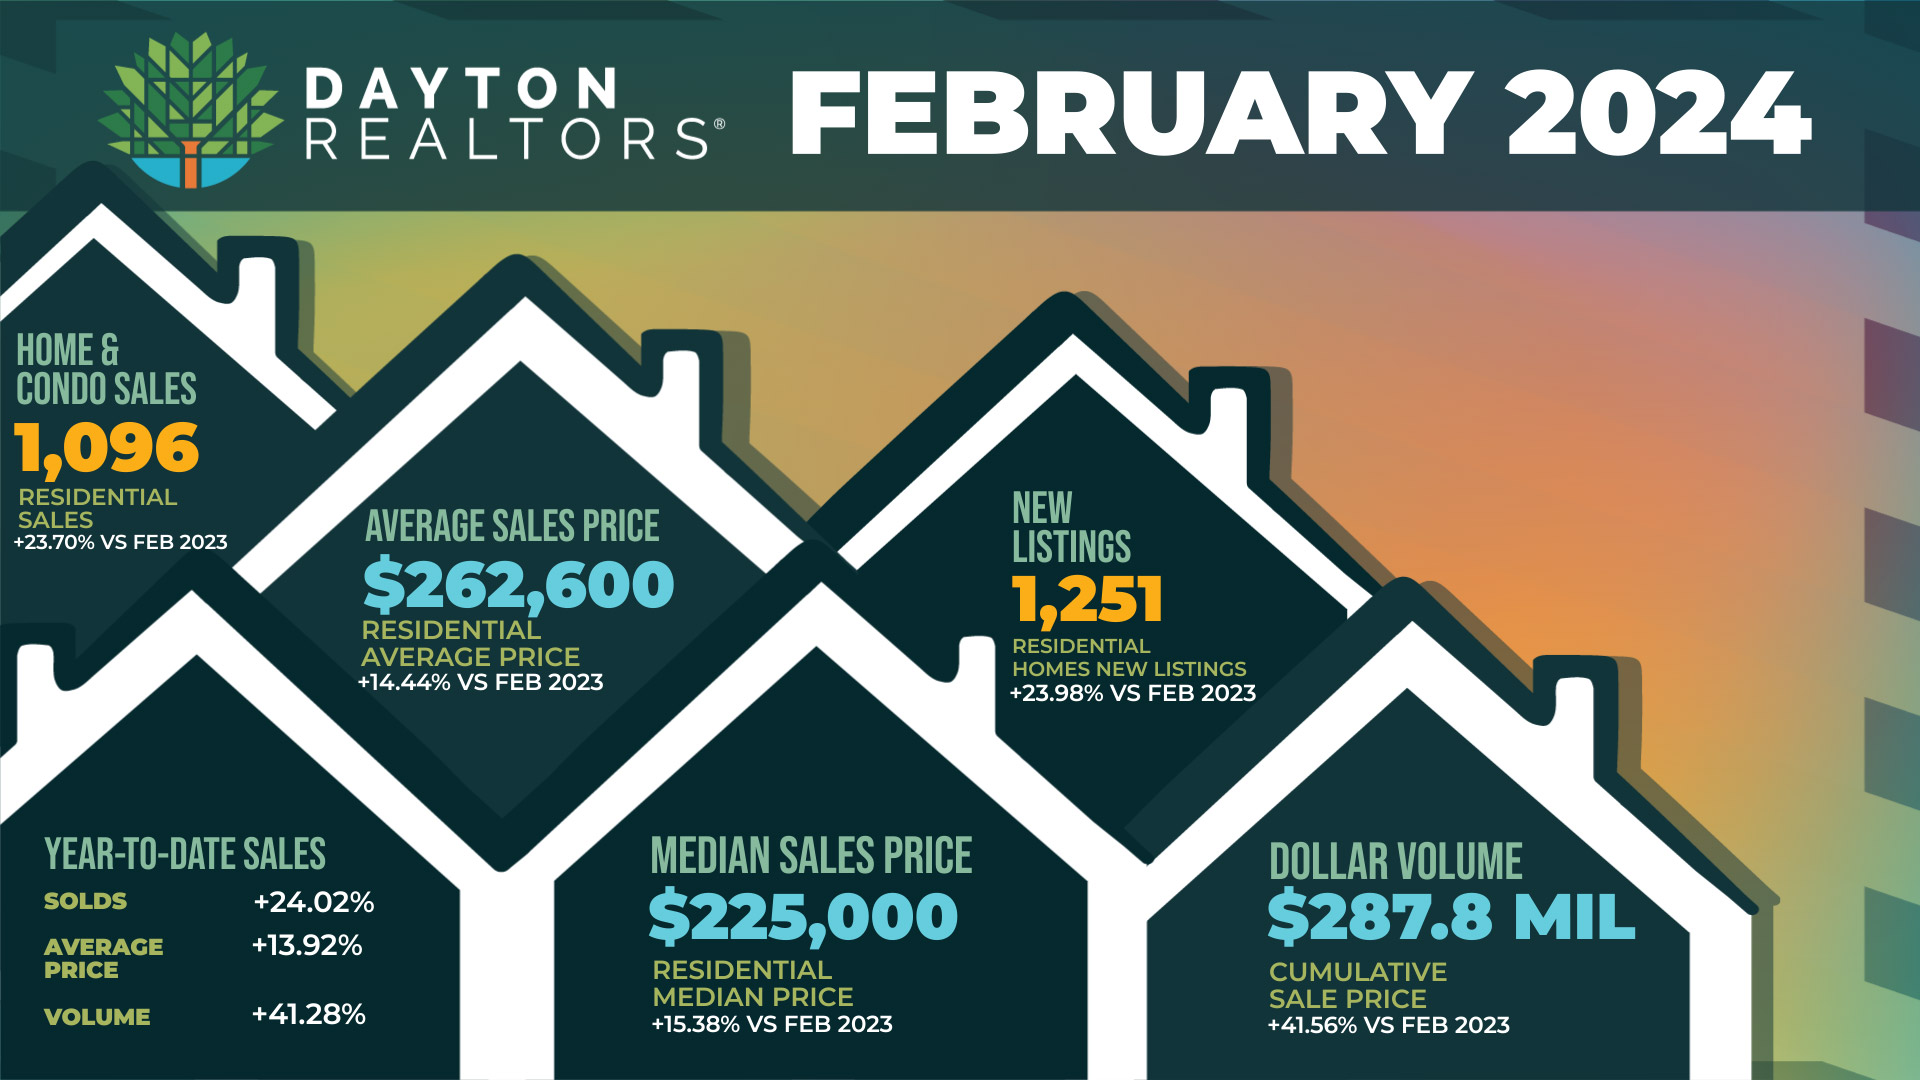
Sales of single-family and condominium units reported by Dayton REALTORS® in February saw a spike in sales and an increase in prices. 1,096 sales were reported to the Multiple Listing Service in February, a 23% increase over the 886 single-family and condominium sales reported in February 2023.
February’s average sales price totaled $262,600, exceeding last year’s monthly figure by over 14%. Meanwhile, the median price also saw an increase, up over 15% from last year to $225,000.
The sales in February produced a cumulative sales volume of $287.8 million, an increase of 41% from last year.
February’s showing also improved the two-month year-to-date sales numbers. The January-February average sales price was up 14% from last year to $259,574, while the median price also jumped ahead by 14% to $219,000. The cumulative sales price totaled $517 million (up 41%) while the number of sales saw a 24% increase to 1,993.
Listings submitted in the month of February showed a jump of 24% to 1,251 entries. For the January-February period, 2,425 listings were entered, up 21% from last year’s 1,994 listings.
The overall active MLS single-family and condominium inventory of available listings at the end of February stood at 1,398 and represented a little more than one month’s supply of listings based on February’s resale rate.
|
FEBRUARY 2024 - MLS SINGLE-FAMILY & CONDO SALES |
|||
|
2024 |
2023 |
% Change |
|
|
New Listings |
1251 |
1009 |
23.98% |
|
Solds |
1096 |
886 |
23.70% |
|
Total Sale Price |
$287,809,897 |
$203,310,940 |
41.56% |
|
% Sale/List Price |
100 |
99.2 |
0.81% |
|
Median Sale Price |
$225,000 |
$195,000 |
15.38% |
|
Average Sales Price |
$262,600 |
$229,471 |
14.44% |
|
JAN-FEB 2024 - MLS SINGLE-FAMILY & CONDO SALES |
|||
|
2024 |
2023 |
% Change |
|
|
New Listings |
2425 |
1994 |
21.61% |
|
Solds |
1993 |
1607 |
24.02% |
|
Total Sale Price |
$517,330,393 |
$366,180,886 |
41.28% |
|
% Sale/List Price |
99.4 |
98.9 |
0.51% |
|
Median Sale Price |
$219,000 |
$191,575 |
14.32% |
|
Average Sales Price |
$259,574 |
$227,866 |
13.92% |
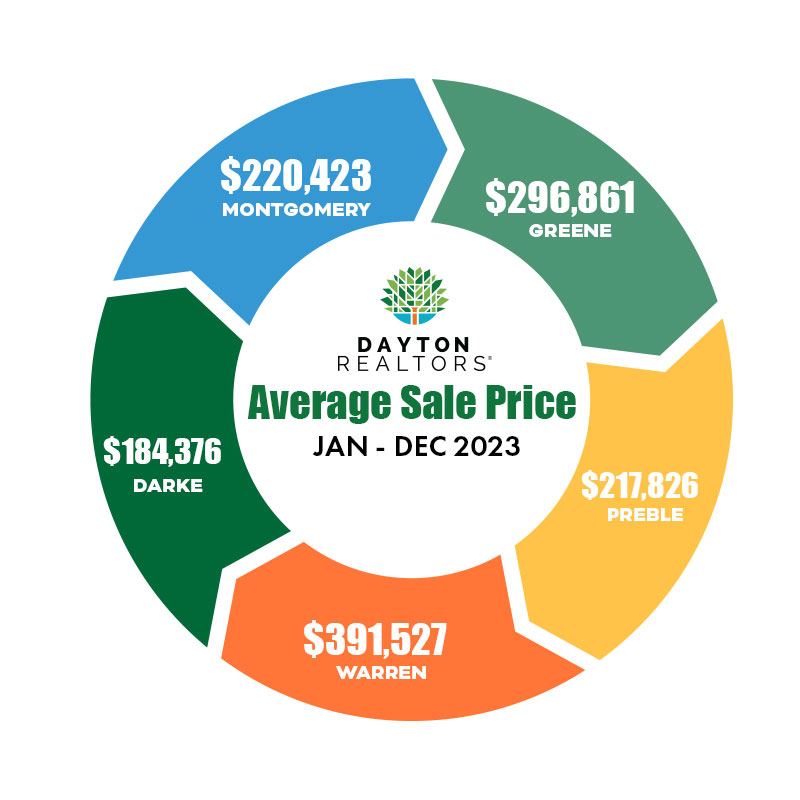
YEARLY SALES BY COMMUNITY - 2023
All statistics are derived from Dayton REALTORS® Multiple Listing Service and are believed to be accurate but not warranted. Please consult with your REALTOR® for more specific statistics.
| Community | Units Sold | Average Sale Price | Median Sale Price |
| Beavercreek/Bvrcrk T.S. | 697 | $342,753 | $320,000 |
| Bellbrook/Sugarcreek | 250 | $427,118 | $414,500 |
| Brookville | 133 | $274,310 | $274,000 |
| Centerville/Wash. T.S. | 855 | $352,337 | $330,000 |
| Dayton | 1574 | $119,239 | $114,150 |
| Eaton | 159 | $215,598 | $185,000 |
| Englewood/Clayton | 503 | $226,033 | $215,000 |
| Fairborn/Bath T.S. | 439 | $220,052 | $190,000 |
| Franklin/Carlisle | 305 | $246,072 | $238,000 |
| Huber Heights | 602 | $214,881 | $194,450 |
| Jamestown/Cedarville | 82 | $247,844 | $219,950 |
| Kettering | 749 | $240,234 | $225,000 |
| Miamisburg/Miami Twp | 464 | $268,455 | $249,950 |
| New Lebanon | 71 | $194,240 | $170,000 |
| Oakwood | 151 | $420,965 | $360,000 |
| Springboro/Clearcreek T.S. | 495 | $455,705 | $410,000 |
| Trotwood | 171 | $145,409 | $140,000 |
| Vandalia | 266 | $269,504 | $252,995 |
| Waynesville | 84 | $380,575 | $322,250 |
| W. Carrollton | 333 | $165,523 | $163,500 |
| Xenia | 381 | $210,841 | $189,900 |
| Yellow Springs | 34 | $368,322 | $348,850 |